14 · Machine-Level Code on RISC-V
Chapter header
| Target | xv6 — the teaching kernel under QEMU |
| Prerequisites | ch05 |
| What it measures | Frame sizes and instruction mix for four functions at -O0 and -O2: bench/results/framesizes-riscv64.json |
The question
What did the compiler actually emit, and how do I read it?
ch02 taught you to read a line of one: which column is which, what an operand means, what the number in front of the parentheses is. This chapter is about what the lines say between them, which is a different skill — and the one the listings in Part III have been quietly assuming. By the end of it you should be able to open an unfamiliar function, find where its arguments went, work out how much stack it wanted and why, and walk back up the chain of calls that reached it — by hand, and then in a debugger, and understand that these are the same operation.
The material
There are two kinds of register, and that is most of the convention
A machine has a fixed number of registers and any function may use any of them. That is a problem the moment one function calls another: the callee will want registers, and the caller still needs what was in them.
There are only two ways to settle it, and a calling convention picks both. Either the caller saves a register before making the call and restores it afterwards, or the callee saves it on entry and puts it back before returning. Every register is assigned to one group or the other RISC-V International (n.d.), and that assignment is why a prologue — the instructions that set up a function’s stack frame — looks the way it does.
The consequence is about lifetime, not about register numbers:
A value you need after a call should live in a callee-saved register, because the callee is obliged to hand it back unchanged. It costs a store in the prologue and a load in the epilogue — the matching instructions that take the frame down again — paid once per function.
A value you need only between calls can live in a caller-saved one, which costs nothing at all, because nobody has promised anything about it.
The compiler makes that decision for every value in every function, and a great deal of what looks like arbitrary register choice in a disassembly is this rule being applied. Appendix A lists which register is in which group; the list is not worth memorising and the rule is.
A stack frame is a linked list
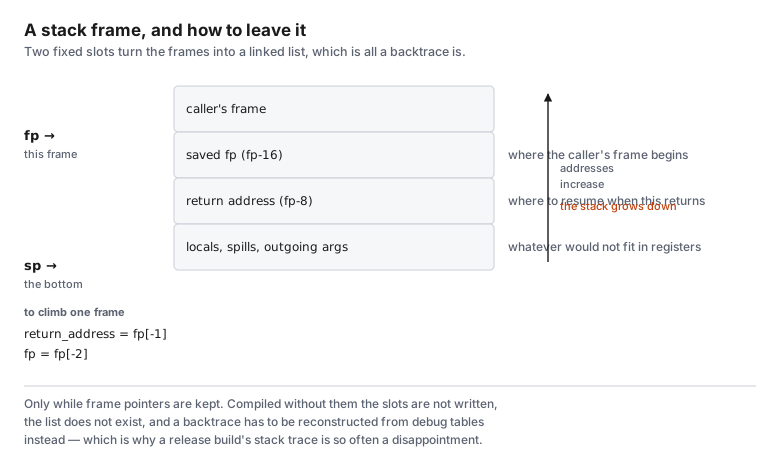
Two fixed slots, and the frames become something you can walk.
When a function needs more room than the registers give it — somewhere to put a callee-saved register it wants to use, somewhere for an array, somewhere for arguments beyond the ones that travel in registers — it takes that room from the stack, by subtracting from the stack pointer. That block is its frame.
Two of the slots in it sit at fixed offsets, which is what makes a backtrace possible: the return address — where the call came from, and so where the function will resume — and the caller’s frame pointer, the register that marks where a frame starts. Follow the second and you are in the caller’s frame; read the first and you know where it will resume. That is a linked list, and walking it is a loop:
  for (int depth = 0; depth < SYSFS_MAX_FRAMES; depth++) {
    void *return_address = frame[RETURN_ADDRESS_SLOT];
    void **caller = (void **)frame[SAVED_FRAME_SLOT];

    /* Stop before dereferencing nonsense. The outermost frame's saved pointer is not another
     * frame, and a walker that trusts it reads whatever happens to be there — which is how a
     * stack trace comes to contain a function that was never called. */
    if (caller == NULL || caller <= frame) {
      printf("frame %d end\n", depth);
      break;
    }
Build it and run it here:
./run framewalkCheck it against the expected frames:
python3 -m pytest tests/test_framewalk.py -qA debugger does exactly this, with two differences: it reads the frames out of another process,
and it can do the walk without frame pointers by consulting tables the compiler emitted for the
purpose. That second ability is why gdb can produce a backtrace in code compiled without
-fno-omit-frame-pointer, and why it sometimes cannot.
framewalk.c marks all three of its call-chain functions noinline, and the comment saying why
is a lesson rather than a workaround:
/* `noinline` on all three, and the reason is the lesson rather than a workaround. Without it the
 * optimiser inlines this chain into main and the walk below finds one frame where the source has
 * four — because there genuinely is one. A frame is not a call in the source, it is a call the
 * machine still makes, and inlining is the commonest reason a stack trace is shorter than the
 * code that produced it. */
A frame is not a call in the source. It is a call the machine still makes. Inlining is the commonest reason a stack trace is shorter than the code that produced it, and the commonest reason a function you are certain is on the stack does not appear in the backtrace.
How much stack does a function need?
There is no general answer. Four functions, compiled twice:
| Function | Frame -O0 | Frame -O2 | Instructions -O0 | Instructions -O2 | Memory ops -O0 | Memory ops -O2 |
|---|---|---|---|---|---|---|
sysfs_leaf | 32 | 0 | 20 | 3 | 7 | 0 |
sysfs_calls_out | 32 | 16 | 18 | 8 | 6 | 2 |
sysfs_many_locals | 112 | 0 | 46 | 12 | 30 | 0 |
sysfs_accumulates | 48 | 48 | 35 | 32 | 18 | 13 |
Conditions: target xv6 · riscv64 cross compiler, any machine — nothing here was executed · riscv64-linux-gnu-gcc (Ubuntu 13.3.0-6ubuntu2~24.04.1) 13.3.0 · -Wall -Wextra -march=rv64gc -mabi=lp64d -c, at -O0 and -O2 · 2026-09-17 · Source: bench/results/framesizes-riscv64.json, code hash 6d902f888daf3ea8.
Read across, then down.
sysfs_leaf calls nothing. At -O0 it still takes a frame and still writes to it, because
-O0 puts every named value in memory and reloads it on each use — that is what makes stepping
through unoptimised code in a debugger so pleasant and what makes it so slow. At -O2 it has no
frame at all and touches no memory: arguments arrive in registers, the result leaves in one, and
nothing ever needed an address.
sysfs_many_locals is the striking one. It takes eight arguments and computes four
intermediates, and at -O0 it wants the largest frame in the table and does more memory
operations than it has instructions at -O2. At -O2 it needs no frame either. Everything fit.
That pair shows what an optimiser is actually for. It is not making the arithmetic cleverer — the multiplications are the same multiplications. It is keeping values in registers instead of in memory, and the difference between those two is the subject of ch25.
sysfs_calls_out keeps a frame at -O2, and a small one. It calls something, so the return
address in ra — the register a call leaves it in — is no longer safe where it is: the callee’s
own jal, the call instruction, will overwrite it. A frame appears for exactly one reason and
holds exactly one thing.
sysfs_accumulates keeps the same frame at both levels. It has a loop with a call in it, and
a running total that must survive each call. That total has to live in a callee-saved register, and
a callee-saved register has to be saved. The optimiser cannot make this one disappear because the
requirement is not an inefficiency; it is the convention being obeyed.
Reading a prologue
Two of those functions, as the compiler emitted them. The leaf:
sysfs_leaf compiled for riscv64 at -O2 — the xv6 target’s instruction set, 3 instructions.
0000000000000000 <sysfs_leaf>:
   0:	mulw	a1,a0,a1
   4:	addw	a0,a0,a1
   6:	ret
Conditions: target xv6 · riscv64 cross compiler, any machine — nothing here was executed · riscv64-linux-gnu-gcc (Ubuntu 13.3.0-6ubuntu2~24.04.1) 13.3.0 · -O2 -Wall -Wextra -march=rv64gc -mabi=lp64d -c · 2026-09-17 · Source: bench/results/frames-riscv64.json, code hash 6b398372e546affb.
No prologue, no epilogue, no memory. Arguments in, answer out.
And the one that calls:
sysfs_calls_out compiled for riscv64 at -O2 — the xv6 target’s instruction set, 8 instructions.
0000000000000008 <sysfs_calls_out>:
   8:	addi	sp,sp,-16
   a:	sd	ra,8(sp)
   c:	auipc	ra,0x0
  10:	jalr	ra # c <sysfs_calls_out+0x4>
  14:	ld	ra,8(sp)
  16:	addiw	a0,a0,1
  18:	addi	sp,sp,16
  1a:	ret
Conditions: target xv6 · riscv64 cross compiler, any machine — nothing here was executed · riscv64-linux-gnu-gcc (Ubuntu 13.3.0-6ubuntu2~24.04.1) 13.3.0 · -O2 -Wall -Wextra -march=rv64gc -mabi=lp64d -c · 2026-09-17 · Source: bench/results/frames-riscv64.json, code hash 6b398372e546affb.
You will see this shape several thousand times: make room, put the return address in it, do the work, take the return address back, release the room, return. A prologue and an epilogue are a matched pair, and the number in both is the same number.
Control flow is a comparison and a branch
There are no loops in machine code and no if statements. There is a comparison, and there is a
branch that is taken or not — which is why ch12’s counted loop ended in a branch pointing
backwards, and why a loop and an if look so similar once compiled.
RISC-V folds the comparison and the branch into one instruction, which is a design choice rather than a universal: it has no condition-code register — no register that remembers the result of the last comparison — so there is nothing to carry between them. That difference resurfaces in ch26 on a machine that does have one, and it is one of the few places where the two architectures genuinely do not translate word for word.
Stepping it in the debugger
Everything above can also be done interactively against a real xv6 binary, where you can step the instructions rather than read them:
make xv6-gdb # in one terminal: boots halted, waitingAppendix B has the workflow — attaching, setting a breakpoint in a user program, stepping one
instruction at a time, and printing the registers. Do this at least once: break on entry to a
function, read the frame pointer, and find the return address yourself with x/gx, then type
backtrace and watch the debugger produce the same answer.
What we measured
Frame sizes and instruction counts, read out of the disassembly, at two optimisation levels. They are counts rather than costs, stamped as artefacts, and regenerated by CI.
The table establishes one thing: whether a function needs a frame is a property of what it does, not of how big it looks. Two of these four shed their frames entirely under optimisation and two did not, and the two that did not are exactly the two that call something. That is a rule you can apply to a function you have never seen.
What this cannot tell you
Whether a frame costs anything. A store and a load in a prologue is two memory operations, and what they cost depends on whether that stack line is in cache — which it almost always is, for reasons ch25 explains and this chapter has no way to demonstrate.
Whether -O0 is “slower”. It is certainly more instructions and far more memory traffic, and
those are the numbers above. Turning that into a ratio requires a clock and a machine, and this
chapter has neither. It is a common mistake to assume the ratio follows the instruction count;
ch27 is largely about why it does not.
What the registers are called on the other machine. Everything here is RISC-V. AArch64 divides its registers the same way, into caller-saved and callee-saved, and gives them entirely different names and a different number of argument registers. The rule transfers; the table does not, and Appendix F is the translation for the reader who meets it in ch26.
How the compiler chose. Register allocation is an optimisation problem with a large literature and this chapter deliberately does not enter it. It teaches how to read the result instead, which is the durable skill: allocators change, and prologues do not.
Problems
Three, and the first is the hardest thing in Part III so far.
14.1 — Write the C that produced this. A listing, and you write a C function that compiles to the same instructions. Not similar ones — the same ones, in order. The test compiles your attempt with the same toolchain and compares mnemonic by mnemonic, so a function that gets the right answer another way does not pass.
Reconstructing the behaviour is the easy half. Reconstructing the compiler’s route to it means asking why that instruction and not the obvious one, which is the question this chapter has been teaching you to ask.
python3 -m pytest tests/machine_level_code_on_riscv/test_problem_1_reconstruct.py14.2 — Which of these needs a frame?
Four functions. For each, predict whether it gets a frame at -O2 and whether it saves the return
address. The test compiles each one and reads the prologue, so you are predicting a compiler
rather than reciting a rule — and the reasoning that explains the table above explains all four.
python3 -m pytest tests/machine_level_code_on_riscv/test_problem_2_frames.py14.3 — Who saves what? Name one register a function writes without saving, and one it saves before using. The test checks both against the actual disassembly and against which half of the convention each belongs to, so an answer that is mechanically true but comes from the wrong group fails and tells you so.
python3 -m pytest tests/machine_level_code_on_riscv/test_problem_3_who_saves.pyWhere to go next
The RISC-V psABI RISC-V International (n.d.) is the document that decides everything in this chapter that is not a compiler’s choice: which registers are caller-saved, where arguments go, how the stack is aligned, and what a frame must look like. It is short by the standards of such documents and the register table in it is worth having open the first few times you read a disassembly.
The unprivileged specification RISC-V International (n.d.) defines the instructions themselves. Its
instruction listing answers “what does sd actually do” faster than any tutorial.
xv6’s kernel/swtch.S Cox et al. (n.d.) is a few dozen lines of assembly that save fourteen
registers into one context and restore fourteen from another, and that is the entire mechanism
of a context switch. Read it now. You will not know why it is called or what a context is
until ch21, but you can already read every instruction in it,
which is a good way to find out that you can.
ch15 asks where all this ends up: sections, segments, symbols, and what exec does with
them.
- RISC-V International. (n.d.). RISC-V ELF psABI Specification. https://github.com/riscv-non-isa/riscv-elf-psabi-doc
- RISC-V International. (n.d.). The RISC-V Instruction Set Manual, Volume I: Unprivileged Architecture. https://riscv.org/technical/specifications/
- Cox, R., Kaashoek, M. F., & Morris, R. (n.d.). xv6-riscv. MIT PDOS. https://github.com/mit-pdos/xv6-riscv