30 · Whole-Machine Profiling
Chapter header
| Target | host — the reference machine, natively |
| Prerequisites | ch29 |
| Assumes | that perf can sample. ARM PMUs support counter-overflow interrupts as standard, so this works on the reference machine — but most affordable RISC-V cores do not, and a reader following Part V on one will find this the chapter they cannot run. |
| What it measures | What the program under the profiler does, counted before anyone times it: bench/results/tally-census.json; and where the samples landed, before and after: bench/results/profile-host.json |
The question
How do I find the bottleneck in something I did not write?
Every measurement in this book so far has been of code the book wrote, in a loop chosen to isolate one mechanism, with the answer known before the machine was asked. That is the right shape for learning what a cache is. It is the wrong shape for the situation this is all for: a program you did not write, doing something you do not fully understand, too slowly.
The material
The program, and what it is about to do
sysfs/tools/tally.c reads a stream of records, turns each into a table index, and counts them.
That is the whole description you get, and it is deliberately more than you would usually have.
Before profiling it, write down what it does. Not what it costs — what it does, counted.
| Counted before the profile | Value |
|---|---|
| Records | 1,048,576 |
| Counters in the table | 1,048,576 (4,194,304 bytes) |
| Counters the keys actually reach | 663,430 |
| Cache lines they reach | 65,536 — every line in the table |
| Decode’s conditional, taken | 1,044,530 of 1,048,576 |
| Table in play at once, partitioned | 8,192 (32,768 bytes) |
| Key traffic partitioning adds | 3,145,728 reads, 1,048,576 writes |
Conditions: target host · aarch64 cross build, any machine — run under user-mode QEMU for counts only · aarch64-linux-gnu-gcc · -O2 -g -Wall -Wextra -static · 2026-09-17 · Source: bench/results/tally-census.json, code hash e19cdb43c99e15cf.
Three of those rows are worth staring at.
The keys do not reach every counter in the table, and yet they reach every cache line in it. A line holds a run of adjacent counters, so the untouched entries buy nothing at all: misses are counted in lines, and there are no unvisited lines. This is ch28’s observation about coherence reappearing as an observation about capacity, and both are the same fact — the machine deals in lines, and your data structure does not know that.
The conditional in the decode phase is taken almost every time. It is the most conspicuous thing in the source of that function, and ch27 already established what a branch this lopsided costs a predictor.
And the partitioned arrangement re-reads the keys, which adds substantial extra traffic, in order to shrink the part of the table in play at any one time. Whether that trade pays is not a question the census can answer. That open question is why there is a second arrangement at all.
The census is a prediction, and writing it down first is the method. A profile with nothing
committed to beforehand is remarkably easy to agree with: whatever it blames becomes what you
expected all along, and the exercise teaches nothing. bench/run_profile.py refuses to stamp a
census in which the two arrangements stop computing the same answer, or the scattered pass stops
reaching every line, or the conditional stops being lopsided — because any of those would leave
the chapter pointing confidently at the wrong phase.
What a profiler actually does
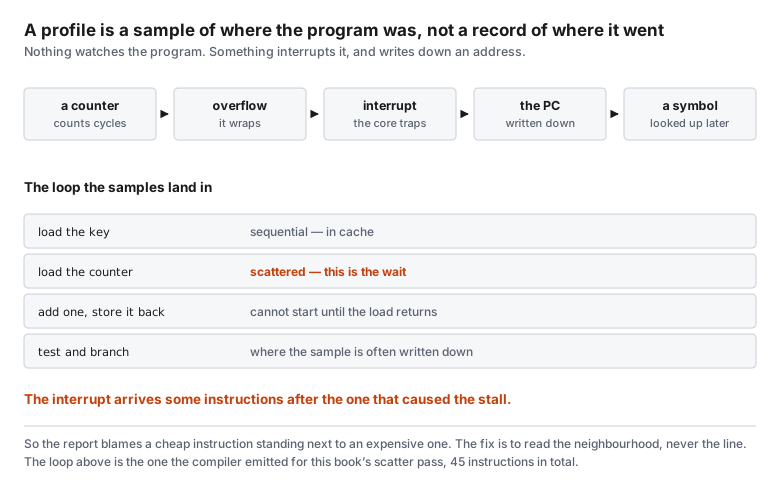
The address written down is the one the core had reached when the interrupt arrived, and not the one that was waiting.
Nothing watches your program. A counter in the PMU is set to a large negative number, the core counts cycles into it, it overflows, and the overflow raises an interrupt — which is ch19’s mechanism, in hardware you have already met, doing a job that has nothing to do with a device. The handler writes down where the program was and returns. Later, addresses are matched against symbols.
Everything a profile can and cannot tell you follows from those sentences.
It is statistical, so a symbol holding a small share of the time has a count that is mostly noise — problem 30.2 is how many samples a claim needs before it is worth making, and the answer is often more than the profile you are looking at contains.
It is attributed to an address, so what you get is exclusive time: the samples that landed in each function itself. The symbol at the top of that list is very often a leaf you did not write and cannot change. Problem 30.1 is putting the callers back together, and the reason it matters is that the thing you can change is never the leaf.
And the address written down is the one the core reached when the interrupt was taken, which is not the one that was waiting.
Skid, and why the line is a lie
sysfs_tally_scatter compiled for aarch64 at -O2 — the host target’s instruction set, 45 instructions.
0000000000000090 <sysfs_tally_scatter>:
  90:	stp	x29, x30, [sp, #-48]!
  94:	mov	x6, x2
  98:	mov	x29, sp
  9c:	stp	x19, x20, [sp, #16]
  a0:	mov	x20, x0
  a4:	mov	x19, x1
  a8:	stp	x21, x22, [sp, #32]
  ac:	mov	w22, w3
  b0:	cbz	w3, 12c <sysfs_tally_scatter+0x9c>
  b4:	mov	x0, x6
  b8:	mov	w21, w3
  bc:	ubfiz	x2, x22, #2, #32
  c0:	mov	w1, #0x0                   	// #0
  c4:	bl	0 <memset>
  c8:	mov	x6, x0
  cc:	cbz	x19, fc <sysfs_tally_scatter+0x6c>
  d0:	mov	x4, #0x0                   	// #0
  d4:	nop
  d8:	ldr	w2, [x20, x4, lsl #2]
  dc:	add	x4, x4, #0x1
  e0:	ldr	w5, [x6, x2, lsl #2]
  e4:	add	w5, w5, #0x1
  e8:	str	w5, [x6, x2, lsl #2]
  ec:	cmp	x19, x4
  f0:	b.hi	d8 <sysfs_tally_scatter+0x48>  // b.pmore
  f4:	cbz	w22, 130 <sysfs_tally_scatter+0xa0>
  f8:	mov	w21, w22
  fc:	sub	x6, x6, #0x4
 100:	mov	x1, #0x1                   	// #1
 104:	mov	x0, #0x0                   	// #0
 108:	ldr	w3, [x6, x1, lsl #2]
 10c:	cmp	x21, x1
 110:	madd	x0, x3, x1, x0
 114:	add	x1, x1, #0x1
 118:	b.ne	108 <sysfs_tally_scatter+0x78>  // b.any
 11c:	ldp	x19, x20, [sp, #16]
 120:	ldp	x21, x22, [sp, #32]
 124:	ldp	x29, x30, [sp], #48
 128:	ret
 12c:	cbnz	x1, d0 <sysfs_tally_scatter+0x40>
 130:	ldp	x19, x20, [sp, #16]
 134:	mov	x0, #0x0                   	// #0
 138:	ldp	x21, x22, [sp, #32]
 13c:	ldp	x29, x30, [sp], #48
 140:	ret
Conditions: target host · aarch64 cross compiler, any machine — nothing here was executed · aarch64-linux-gnu-gcc (Ubuntu 13.3.0-6ubuntu2~24.04.1) 13.3.0 · -O2 -Wall -Wextra -c · 2026-09-17 · Source: bench/results/profiling-aarch64.json, code hash 70477bce1e82551b.
The inner loop of the scattered pass is a handful of instructions, and the census has already told you which one will stall: the second load, the one indexed by the key, reaching into a table far too large to sit in cache. The load after it and the store after that cannot proceed until it returns.
The stall is real and it belongs to that load. The sample lands somewhere after it, because the interrupt is taken when the machine notices, and by then the program counter has moved on.
| Instruction | Offset | Samples |
|---|---|---|
d44: stp x29, x30, [sp, #-48]! | +0 | 0.0% |
d48: mov x7, x2 | +1 | 0.0% |
d4c: mov x29, sp | +2 | 0.0% |
d50: stp x19, x20, [sp, #16] | +3 | 0.0% |
d54: mov x20, x0 | +4 | 0.0% |
d58: mov x19, x1 | +5 | 0.0% |
d5c: stp x21, x22, [sp, #32] | +6 | 0.0% |
d60: mov w22, w3 | +7 | 0.0% |
d64: cbz w3, de4 <sysfs_tally_scatter+0xa0> | +8 | 0.0% |
d68: mov x0, x7 | +9 | 0.0% |
d6c: mov w21, w3 | +10 | 0.0% |
d70: ubfiz x2, x22, #2, #32 | +11 | 0.0% |
d74: mov w1, #0x0 // #0 | +12 | 0.0% |
d78: bl 750 <memset@plt> | +13 | 0.0% |
d7c: mov x7, x0 | +14 | 0.0% |
d80: cbz x19, db0 <sysfs_tally_scatter+0x6c> | +15 | 0.0% |
d84: mov x5, #0x0 // #0 | +16 | 0.0% |
d88: ldr w4, [x20, x5, lsl #2] | +17 | 0.0% |
d8c: add x5, x5, #0x1 | +18 | 0.36% |
d90: lsl x4, x4, #2 | +19 | 0.0% |
d94: ldr w6, [x7, x4] | +20 | 0.0% |
d98: add w6, w6, #0x1 | +21 | 92.71% |
d9c: str w6, [x7, x4] | +22 | 0.0% |
da0: cmp x19, x5 | +23 | 0.0% |
da4: b.hi d88 <sysfs_tally_scatter+0x44> // b.pmore | +24 | 0.0% |
da8: cbz w22, de8 <sysfs_tally_scatter+0xa4> | +25 | 0.0% |
dac: mov w21, w22 | +26 | 0.0% |
db0: sub x7, x7, #0x4 | +27 | 0.0% |
db4: mov x0, #0x0 // #0 | +28 | 0.0% |
db8: mov x1, #0x1 // #1 | +29 | 0.0% |
dbc: nop | +30 | 0.0% |
dc0: ldr w3, [x7, x1, lsl #2] | +31 | 0.0% |
dc4: cmp x21, x1 | +32 | 6.39% |
dc8: umaddl x0, w3, w1, x0 | +33 | 0.18% |
dcc: add x1, x1, #0x1 | +34 | 0.0% |
dd0: b.ne dc0 <sysfs_tally_scatter+0x7c> // b.any | +35 | 0.36% |
dd4: ldp x19, x20, [sp, #16] | +36 | 0.0% |
dd8: ldp x21, x22, [sp, #32] | +37 | 0.0% |
ddc: ldp x29, x30, [sp], #48 | +38 | 0.0% |
de0: ret | +39 | 0.0% |
de4: cbnz x1, d84 <sysfs_tally_scatter+0x40> | +40 | 0.0% |
de8: ldp x19, x20, [sp, #16] | +41 | 0.0% |
dec: mov x0, #0x0 // #0 | +42 | 0.0% |
df0: ldp x21, x22, [sp, #32] | +43 | 0.0% |
df4: ldp x29, x30, [sp], #48 | +44 | 0.0% |
df8: ret | +45 | 0.0% |
Conditions: target host · Raspberry Pi 5 Model B Rev 1.1 · Linux 6.18.50+rpt-rpi-2712 · cc (Debian 14.2.0-19) 14.2.0 · -O2 -g -Wall -Wextra · 2026-09-16 · Source: bench/results/skid-host.json, code hash fb4c63af07e67d03.
Almost every sample in that loop landed on one instruction, and the instruction is an add of one
to a register. Nothing about an increment is expensive on any machine in this book. What is
expensive is what happened a few instructions earlier and had not finished, and the increment is
merely where the core had got to when the counter overflowed.
So the rule for reading a profile at instruction granularity is to read the neighbourhood and never the line. An instruction with no reason to be expensive, sitting shortly after one with every reason, is not a mystery. It is the shape of the measurement.
Aliasing, and why it is worse than noise
There is a second way a profile misleads, and unlike skid it leaves no trace.
A profiler sampling at a fixed period, over a loop of fixed length, does not sample the loop evenly. The sample positions walk around the loop in steps of the sampling period, and that walk does not visit every position — it visits the multiples of a number that problem 30.3 asks you to find. When the two periods share a large factor, the profile lands on a handful of positions out of thousands, every time, on every run, reproducibly.
This is worse than a noisy profile, because a noisy profile looks noisy. An aliased one looks like a finding. It is stable across runs, it is consistent between machines with the same timing, and it will tell you with great confidence that one instruction in a loop is responsible for everything.
The fix is not to choose the period more carefully; there is no period that is coprime to every loop. It is to make the period slightly random, which real profilers do, and which is worth knowing about because it is the reason the tool’s defaults are not round numbers.
The two profiles, before and after
| Symbol | Before | After |
|---|---|---|
sysfs_tally_scatter | 99.08% | 0.0% |
0x00000000000a4358 | 0.89% | 6.39% |
sysfs_tally_partitioned | 0.0% | 93.55% |
Conditions: target host · Raspberry Pi 5 Model B Rev 1.1 · Linux 6.18.50+rpt-rpi-2712 · cc (Debian 14.2.0-19) 14.2.0 · -O2 -g -Wall -Wextra · 2026-09-16 · Source: bench/results/profile-host.json, code hash fb4c63af07e67d03.
The change is the second arrangement: partition the keys so that every increment lands in a slice of the table small enough to stay resident, at the cost of reading the keys twice more and writing them once more.
The blame moved completely. Before, one symbol held essentially all of the samples; after, that symbol holds none and its replacement holds nearly all of them. A profile could hardly be more emphatic.
And it does not say whether the program got faster. A profile reports shares, and shares sum to one whatever the total is: a program that took twice as long would produce this same table if its time were distributed the same way. Reading that emphatic a move as a result is the mistake this whole part is arranged to prevent — the number that would settle it is a duration, taken ch24’s way, before and after, and this chapter did not take one. The census predicted where the time would move and the profile confirms it moved there. Whether the trade paid is a separate measurement, and it has not been made here.
What we measured
The census: what the program touches, counted, in units that do not depend on any machine. CI re-runs it on every push and refuses three specific ways it could stop describing the chapter. Alongside it, the disassembly of the scattered inner loop, which is what makes the skid discussion concrete rather than a warning.
Measured on the board: the profiles themselves, before and after, and the instruction-level samples that show where the skid put them. All of it is shares of samples; no duration was taken, which is why the section above declines to say which arrangement is faster.
What this cannot tell you
Where the time goes in a program that is not CPU-bound. Sampling on cycles finds code that is executing. A program waiting on a disk, a socket or a lock is not executing, and a cycle-sampled profile of it will be a beautifully detailed picture of the small part that was. The counters for that are different ones and the tooling is a different chapter.
Anything about a machine whose PMU cannot interrupt. The header says this and means it. The
counting parts of perf work on far more hardware than the sampling parts; the census in this
chapter was designed to be useful to a reader in that position, and the profile cannot be.
Whether the symbol is the cause. A profile is a map of where time was spent, which is a different question from what is responsible for spending it. The scattered pass is expensive because of a decision made in the decode phase about how keys are distributed, and no amount of sampling inside the loop points at that.
How to profile something that is fast. Every technique here needs the program to run long enough to collect samples. For anything shorter, the equipment is ch24’s — repetition and a distribution — and the two do not substitute for each other.
Whether the change in this chapter was an improvement. Said above and repeated here because it is the easiest thing on the page to forget: a profile ranks, and a ranking is not a total. Every claim of the form “this made it faster” in this book rests on a duration, and this chapter has none.
What it costs to measure. The interrupt has to be taken, the handler has to run, and the sample has to be written down. At a high sampling rate that is not free, and it is charged to the program being measured. Nothing in this chapter tells you how much, because measuring the cost of a measurement with the same measurement is circular.
Problems
Three, in tests/whole_machine_profiling/profiler.c.
30.1 — Flat to inclusive. Given a call tree and the profiler’s exclusive counts, work out what each function cost including everything it called. The symbol you can change is never the one at the top of the flat list.
python3 -m pytest tests/whole_machine_profiling/test_problem_1_inclusive.py30.2 — How many samples is a claim? Derive the closed form for the number of samples a share needs before it is worth believing. It is small enough to do in your head with a profile on the screen, which is the point of deriving it.
python3 -m pytest tests/whole_machine_profiling/test_problem_2_noise.py30.3 — Why the period is random. A fixed sampling period over a fixed loop visits only some positions. Work out how many, and the reason real profilers jitter will follow from the formula rather than from being told.
python3 -m pytest tests/whole_machine_profiling/test_problem_3_aliasing.pyWhere to go next
perf_event_open(2) Linux man-pages project (n.d.) is the interface everything in this chapter sits on, and it
is worth reading once even if you never call it: the structure it takes is a list of every
decision a profiler makes on your behalf. Mytkowicz and colleagues Mytkowicz et al. (2009) is the
paper to read on measurement bias — it shows profilers disagreeing with each other about the same
program, for reasons that are nobody’s bug, and it is the best available argument for the habit this
chapter is built on: writing the prediction down first.
ch31 is the last measurement in the book and the narrowest: one loop, one unit, and the question of what vectorising actually buys when it is measured against the arithmetic rather than against the version you started with.
- Linux man-pages project. (n.d.). perf_event_open(2) — Linux manual page. https://man7.org/linux/man-pages/man2/perf_event_open.2.html
- Mytkowicz, T., Diwan, A., Hauswirth, M., & Sweeney, P. F. (2009). Producing Wrong Data Without Doing Anything Obviously Wrong! Proceedings of the 14th International Conference on Architectural Support for Programming Languages and Operating Systems (ASPLOS). 10.1145/1508244.1508275