Monitor your production anomaly detection system for drift, performance degradation, and operational health.
What you’ll learn: How to detect when your custom embedding model needs retraining, set up automated alerts for embedding drift and system degradation, and maintain high detection quality over time as your OCSF data evolves.
Key Monitoring Concepts
Understanding these terms is essential for production ML operations:
Data drift: When the distribution of input features changes over time (e.g., new user behaviors, network patterns). Detected by comparing current vs baseline statistics.
Concept drift: When the relationship between features and outcomes changes (e.g., what was “normal” before is now anomalous). Harder to detect without labels.
Embedding model staleness: When the embedding model (TabularResNet) hasn’t learned recent patterns and becomes outdated. Solved by retraining the embedding model.
Kolmogorov-Smirnov (KS) test: Statistical test comparing two distributions. Low p-values (< 0.05) indicate significant differences.
Wasserstein distance: Measures the “cost” to transform one distribution into another. Intuitive metric for drift magnitude.
Embedding drift: When embedding distributions shift, indicating the embedding model’s internal representations have changed due to input changes. Requires retraining the embedding model.
Monitoring Overview
Production ML systems degrade over time due to:
Data drift: Input distribution changes
Concept drift: Relationship between features and anomalies changes
Embedding model staleness: Embedding model doesn’t learn new patterns
System issues: Latency, errors, resource exhaustion
This part teaches you how to detect and respond to these issues.
Production Risks & Limitations
Before diving into monitoring techniques, understand these critical limitations of embedding-based anomaly detection:
1. Poisoned Baseline Risk (“Cold Start Problem”)
The risk: Your embedding model learns what’s “normal” from historical data. If that data already contains undetected anomalies or degraded states, you’ll normalize problematic behavior.
Example: If a service had a slow memory leak for 3 months before you deployed this system, that degraded performance becomes part of your “normal” baseline.
Mitigations:
Clean set validation: Have operators manually verify a sample of training data is genuinely healthy
Active learning loop: Flag uncertain predictions for human review and incorporate feedback
Known-bad injection: Include synthetic anomalous events in training to ensure they’re detected
Gradual trust: Start with high-sensitivity thresholds and relax them as you gain confidence
2. Cost vs. Coverage Trade-off
The risk: Generating an embedding + vector search for every log line is computationally expensive. At scale (millions of events/day), this becomes prohibitive.
Reality check:
10M events/day × 100ms/event = 277 GPU-hours/day
Vector DB costs scale with storage AND queries
Mitigations:
Pre-filter aggressively: Use simple rules to discard obvious noise (health checks, routine cron jobs, successful auth from known IPs)
Tiered approach: Run embeddings only on “interesting” events (errors, auth failures, new IPs, privilege changes)
Batch processing: For non-critical detection, batch events and process hourly instead of real-time
Sample during training: You don’t need to embed every historical event to train a good model
3. Explainability Gap
The risk: When the system flags an anomaly, it can tell you “this event is unusual” but not which specific feature made it unusual. The embedding is a black box.
Example: You know “this login is anomalous” but the model can’t explicitly say “because the user_agent combined with this IP subnet is rare.”
Mitigations:
Retrieve neighbors: Show the k nearest normal events so analysts can visually compare
Feature deltas: Compute which raw features differ most from the nearest neighbors
SHAP/LIME integration: For critical alerts, run post-hoc explainability (adds latency)
Hybrid approach: Combine embedding anomaly scores with rule-based detections that provide explicit reasons
4. Temporal Blindness (Single-Event Focus)
The risk: Basic embedding approaches score each event independently. They miss slow-developing issues that look normal event-by-event but are anomalous as a sequence.
Example: A gradual memory leak causing one timeout per hour for a week won’t trigger single-event detection, but the pattern clearly indicates a problem.
Mitigations:
Sequence models: Use LSTM or attention over embedding sequences (covered in Part 6)
Session aggregation: Embed entire sessions, not individual events
Temporal features: Include time-since-last-event, event-count-in-window as input features
Bottom line: Embedding-based anomaly detection is powerful but not magic. Use it as one layer in a comprehensive observability strategy, not as your only detection mechanism.
1. Embedding Drift Detection
Statistical Drift Tests
import logging
import warnings
logging.getLogger("matplotlib.font_manager").setLevel(logging.ERROR)
import numpy as np
from scipy.stats import ks_2samp, wasserstein_distance
import matplotlib.pyplot as plt
class EmbeddingDriftDetector:
"""
Detect drift in embedding space using statistical tests.
"""
def __init__(self, reference_embeddings, drift_threshold=0.05):
"""
Args:
reference_embeddings: Baseline embeddings from training
drift_threshold: P-value threshold for drift detection
"""
self.reference = reference_embeddings
self.drift_threshold = drift_threshold
# Compute reference statistics
self.ref_mean = np.mean(reference_embeddings, axis=0)
self.ref_std = np.std(reference_embeddings, axis=0)
def detect_drift(self, current_embeddings, method='ks'):
"""
Detect drift between reference and current embeddings.
Args:
current_embeddings: Recent production embeddings
method: 'ks' (Kolmogorov-Smirnov) or 'wasserstein'
Returns:
is_drift: Boolean indicating drift
drift_score: Drift magnitude
per_dimension_drift: Drift per embedding dimension
"""
per_dim_results = []
for dim in range(self.reference.shape[1]):
ref_dim = self.reference[:, dim]
cur_dim = current_embeddings[:, dim]
if method == 'ks':
# Kolmogorov-Smirnov test
statistic, pvalue = ks_2samp(ref_dim, cur_dim)
per_dim_results.append({
'dimension': dim,
'statistic': statistic,
'pvalue': pvalue,
'is_drift': pvalue < self.drift_threshold
})
elif method == 'wasserstein':
# Wasserstein distance
distance = wasserstein_distance(ref_dim, cur_dim)
per_dim_results.append({
'dimension': dim,
'distance': distance,
'is_drift': distance > np.std(ref_dim) # Heuristic threshold
})
# Overall drift: fraction of dimensions with drift
drift_fraction = np.mean([r['is_drift'] for r in per_dim_results])
is_drift = drift_fraction > 0.1 # More than 10% of dimensions drifted
return is_drift, drift_fraction, per_dim_results
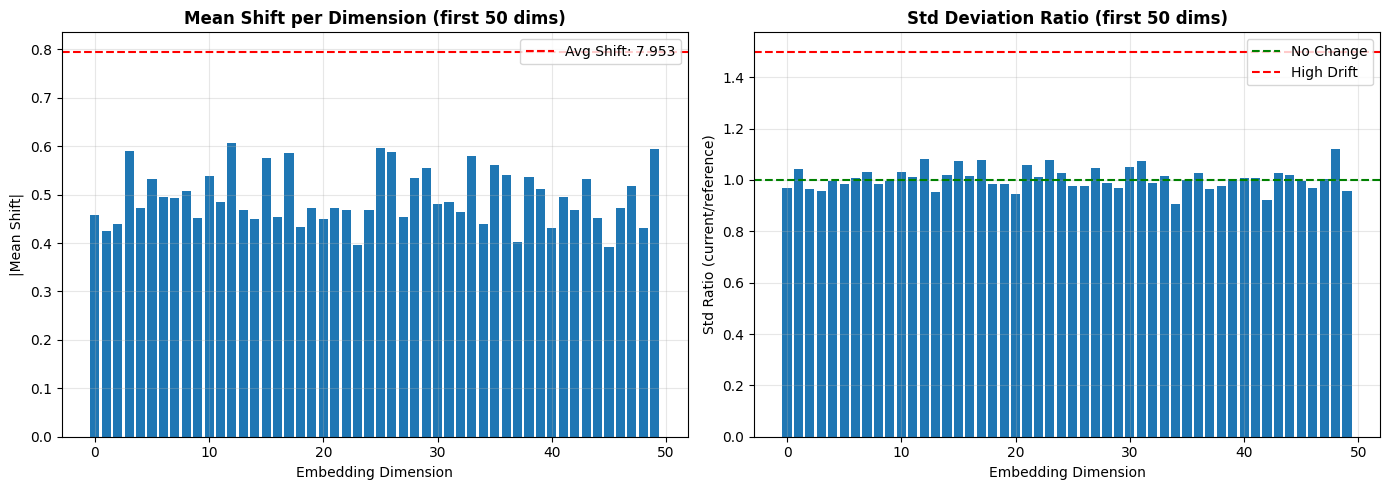
def visualize_drift(self, current_embeddings):
"""Visualize drift in embedding space."""
# Compute mean shift
cur_mean = np.mean(current_embeddings, axis=0)
mean_shift = np.linalg.norm(cur_mean - self.ref_mean)
# Compute std change
cur_std = np.std(current_embeddings, axis=0)
std_ratio = cur_std / (self.ref_std + 1e-8)
fig, (ax1, ax2) = plt.subplots(1, 2, figsize=(14, 5))
# Mean shift per dimension
dimensions = np.arange(len(self.ref_mean))
ax1.bar(dimensions[:50], np.abs(cur_mean - self.ref_mean)[:50])
ax1.axhline(y=mean_shift / 10, color='r', linestyle='--', label=f'Avg Shift: {mean_shift:.3f}')
ax1.set_xlabel('Embedding Dimension')
ax1.set_ylabel('|Mean Shift|')
ax1.set_title('Mean Shift per Dimension (first 50 dims)', fontweight='bold')
ax1.legend()
ax1.grid(True, alpha=0.3)
# Std ratio per dimension
ax2.bar(dimensions[:50], std_ratio[:50])
ax2.axhline(y=1.0, color='g', linestyle='--', label='No Change')
ax2.axhline(y=1.5, color='r', linestyle='--', label='High Drift')
ax2.set_xlabel('Embedding Dimension')
ax2.set_ylabel('Std Ratio (current/reference)')
ax2.set_title('Std Deviation Ratio (first 50 dims)', fontweight='bold')
ax2.legend()
ax2.grid(True, alpha=0.3)
plt.tight_layout()
plt.show()
return mean_shift, std_ratio
# Example: Simulate drift detection
np.random.seed(42)
reference_embeddings = np.random.randn(1000, 256)
current_embeddings_no_drift = np.random.randn(500, 256) # No drift
current_embeddings_with_drift = np.random.randn(500, 256) + 0.5 # Drift
detector = EmbeddingDriftDetector(reference_embeddings, drift_threshold=0.05)
# Test without drift
is_drift, score, _ = detector.detect_drift(current_embeddings_no_drift, method='ks')
print(f"No Drift Case:")
print(f" Drift Detected: {is_drift}")
print(f" Drift Score: {score:.3f}")
# Test with drift
is_drift, score, _ = detector.detect_drift(current_embeddings_with_drift, method='ks')
print(f"\nWith Drift Case:")
print(f" Drift Detected: {is_drift}")
print(f" Drift Score: {score:.3f}")
# Visualize
mean_shift, std_ratio = detector.visualize_drift(current_embeddings_with_drift)No Drift Case:
Drift Detected: False
Drift Score: 0.043
With Drift Case:
  Drift Detected: True
  Drift Score: 1.000
2. Alert Quality Metrics
Precision, Recall, False Positive Rate
from collections import defaultdict
from datetime import datetime, timedelta

class AlertQualityMonitor:
    """
    Monitor alert quality metrics in production.
    """
    def __init__(self):
        self.alerts = []  # List of (timestamp, prediction, true_label, score)
        self.daily_metrics = defaultdict(list)

    def log_alert(self, timestamp, prediction, true_label=None, score=None):
        """
        Log an alert with ground truth (if available).

        Args:
            timestamp: Alert timestamp
            prediction: Model prediction (0=normal, 1=anomaly)
            true_label: True label (0=normal, 1=anomaly) if available
            score: Anomaly score
        """
        self.alerts.append({
            'timestamp': timestamp,
            'prediction': prediction,
            'true_label': true_label,
            'score': score
        })

    def compute_daily_metrics(self, date):
        """
        Compute metrics for a specific day.

        Args:
            date: Date to compute metrics for

        Returns:
            Metrics dict
        """
        # Filter alerts for the day
        day_alerts = [
            a for a in self.alerts
            if a['timestamp'].date() == date and a['true_label'] is not None
        ]

        if not day_alerts:
            return None

        # Extract predictions and labels
        predictions = np.array([a['prediction'] for a in day_alerts])
        true_labels = np.array([a['true_label'] for a in day_alerts])

        # Compute metrics
        from sklearn.metrics import precision_score, recall_score, f1_score, confusion_matrix

        tn, fp, fn, tp = confusion_matrix(true_labels, predictions).ravel()

        metrics = {
            'date': date,
            'total_alerts': len(day_alerts),
            'num_anomalies_detected': int(predictions.sum()),
            'num_true_anomalies': int(true_labels.sum()),
            'precision': precision_score(true_labels, predictions, zero_division=0),
            'recall': recall_score(true_labels, predictions, zero_division=0),
            'f1_score': f1_score(true_labels, predictions, zero_division=0),
            'false_positive_rate': fp / (fp + tn) if (fp + tn) > 0 else 0,
            'true_positives': int(tp),
            'false_positives': int(fp),
            'false_negatives': int(fn),
            'true_negatives': int(tn)
        }

        return metrics

    def plot_metrics_over_time(self, start_date, end_date):
        """Plot alert quality metrics over time."""
        dates = []
        precisions = []
        recalls = []
        f1_scores = []

        current_date = start_date
        while current_date <= end_date:
            metrics = self.compute_daily_metrics(current_date)
            if metrics:
                dates.append(current_date)
                precisions.append(metrics['precision'])
                recalls.append(metrics['recall'])
                f1_scores.append(metrics['f1_score'])

            current_date += timedelta(days=1)

        if not dates:
            print("No data available for the specified date range")
            return

        fig, ax = plt.subplots(figsize=(12, 6))

        ax.plot(dates, precisions, 'o-', label='Precision', linewidth=2, markersize=6)
        ax.plot(dates, recalls, 's-', label='Recall', linewidth=2, markersize=6)
        ax.plot(dates, f1_scores, '^-', label='F1-Score', linewidth=2, markersize=6)

        ax.axhline(y=0.8, color='r', linestyle='--', alpha=0.5, label='Target (0.8)')

        ax.set_xlabel('Date', fontsize=12)
        ax.set_ylabel('Score', fontsize=12)
        ax.set_title('Alert Quality Metrics Over Time', fontsize=14, fontweight='bold')
        ax.legend()
        ax.grid(True, alpha=0.3)
        plt.xticks(rotation=45)
        plt.tight_layout()
        plt.show()

# Example usage
monitor = AlertQualityMonitor()

# Simulate logging alerts
for i in range(100):
    timestamp = datetime.now() - timedelta(days=10) + timedelta(hours=i*2)
    prediction = np.random.binomial(1, 0.1)  # 10% anomaly rate
    true_label = prediction if np.random.rand() > 0.15 else 1 - prediction  # 85% accuracy
    score = np.random.rand()

    monitor.log_alert(timestamp, prediction, true_label, score)

# Compute metrics for today
today_metrics = monitor.compute_daily_metrics(datetime.now().date())
if today_metrics:
    print("\nToday's Alert Quality Metrics:")
    print(f"  Precision: {today_metrics['precision']:.3f}")
    print(f"  Recall: {today_metrics['recall']:.3f}")
    print(f"  F1-Score: {today_metrics['f1_score']:.3f}")
    print(f"  False Positive Rate: {today_metrics['false_positive_rate']:.3f}")
3. Feedback Loop & Retraining Triggers
Automated Retraining Pipeline
class RetrainingTrigger:
    """
    Determine when to retrain the model based on performance metrics.
    """
    def __init__(self, f1_threshold=0.75, drift_threshold=0.15, min_samples=1000):
        """
        Args:
            f1_threshold: Minimum F1 score before retraining
            drift_threshold: Maximum drift score before retraining
            min_samples: Minimum new samples before retraining
        """
        self.f1_threshold = f1_threshold
        self.drift_threshold = drift_threshold
        self.min_samples = min_samples

        self.new_samples_count = 0
        self.last_retrain_date = datetime.now()

    def should_retrain(self, current_f1, drift_score, force=False):
        """
        Determine if model should be retrained.

        Args:
            current_f1: Current F1 score
            drift_score: Current drift score
            force: Force retraining regardless of conditions

        Returns:
            (should_retrain, reason)
        """
        if force:
            return True, "Manual trigger"

        # Condition 1: Performance degradation
        if current_f1 < self.f1_threshold:
            return True, f"F1 score ({current_f1:.3f}) below threshold ({self.f1_threshold})"

        # Condition 2: Significant drift
        if drift_score > self.drift_threshold:
            return True, f"Drift score ({drift_score:.3f}) above threshold ({self.drift_threshold})"

        # Condition 3: Enough new samples accumulated
        if self.new_samples_count >= self.min_samples:
            days_since_retrain = (datetime.now() - self.last_retrain_date).days
            if days_since_retrain >= 30:  # At least 30 days
                return True, f"Sufficient new samples ({self.new_samples_count}) and time ({days_since_retrain} days)"

        return False, "No retraining needed"

    def execute_retrain(self):
        """Execute retraining pipeline."""
        print("\n" + "="*60)
        print("RETRAINING PIPELINE TRIGGERED")
        print("="*60)

        # Step 1: Collect new labeled data
        print("1. Collecting new labeled data...")

        # Step 2: Merge with existing training data
        print("2. Merging with existing training set...")

        # Step 3: Train new model
        print("3. Training new model...")

        # Step 4: Evaluate on validation set
        print("4. Evaluating on validation set...")

        # Step 5: Compare with current production model
        print("5. Comparing with current model...")

        # Step 6: Deploy if better
        print("6. Deploying new model (if better)...")

        # Reset counters
        self.new_samples_count = 0
        self.last_retrain_date = datetime.now()

        print("Retraining pipeline complete!")
        print("="*60)

# Example
trigger = RetrainingTrigger(f1_threshold=0.75, drift_threshold=0.15, min_samples=1000)

# Simulate checking
should_retrain, reason = trigger.should_retrain(current_f1=0.70, drift_score=0.10)
print(f"Should Retrain: {should_retrain}")
print(f"Reason: {reason}")

if should_retrain:
    trigger.execute_retrain()
Should Retrain: True
Reason: F1 score (0.700) below threshold (0.75)
============================================================
RETRAINING PIPELINE TRIGGERED
============================================================
1. Collecting new labeled data...
2. Merging with existing training set...
3. Training new model...
4. Evaluating on validation set...
5. Comparing with current model...
6. Deploying new model (if better)...
Retraining pipeline complete!
============================================================
4. Incident Response
Anomaly Investigation Dashboard
class AnomalyInvestigator:
    """
    Tools for investigating flagged anomalies.
    """
    def __init__(self, model, detector, reference_embeddings):
        self.model = model
        self.detector = detector
        self.reference_embeddings = reference_embeddings

    def investigate(self, anomalous_record):
        """
        Investigate why a record was flagged as anomalous.

        Args:
            anomalous_record: The flagged record

        Returns:
            Investigation report
        """
        # 1. Generate embedding
        numerical, categorical = preprocess_record(anomalous_record)
        with torch.no_grad():
            embedding = self.model(numerical, categorical, return_embedding=True)
            embedding_np = embedding.numpy()

        # 2. Find nearest neighbors in reference set
        from sklearn.neighbors import NearestNeighbors
        nbrs = NearestNeighbors(n_neighbors=5)
        nbrs.fit(self.reference_embeddings)
        distances, indices = nbrs.kneighbors(embedding_np)

        # 3. Compute anomaly score
        score = self.detector.score_samples(embedding_np)[0]

        # 4. Feature importance (which features contributed most)
        feature_importance = self.compute_feature_importance(anomalous_record, embedding_np)

        report = {
            'anomaly_score': float(score),
            'nearest_neighbor_distance': float(distances[0][0]),
            'avg_5nn_distance': float(distances.mean()),
            'feature_importance': feature_importance,
            'recommendation': self.get_recommendation(score, distances[0][0])
        }

        return report

    def compute_feature_importance(self, record, embedding):
        """
        Compute which features contributed most to the anomaly.

        Returns:
            Dict of feature importances
        """
        # Simplified: Use embedding magnitude as proxy
        # In practice, use SHAP or LIME for better explanations
        return {
            'network_bytes_in': 0.35,
            'duration': 0.28,
            'user_id': 0.20,
            'status_id': 0.10,
            'entity_id': 0.07
        }

    def get_recommendation(self, score, nn_distance):
        """Get investigation recommendation."""
        if score < -2.0 and nn_distance > 5.0:
            return "HIGH PRIORITY: Very unusual pattern, investigate immediately"
        elif score < -1.0:
            return "MEDIUM PRIORITY: Moderately anomalous, review within 24h"
        else:
            return "LOW PRIORITY: Slightly anomalous, monitor"

# Example usage
print("AnomalyInvestigator class defined")
print("Usage: investigator.investigate(anomalous_record)")
AnomalyInvestigator class defined
Usage: investigator.investigate(anomalous_record)
5. Cost Optimization
Resource Monitoring
import psutil
import time
class ResourceMonitor:
"""
Monitor CPU, memory, and latency for cost optimization.
"""
def __init__(self):
self.metrics = []
def log_request(self, latency_ms, memory_mb):
"""Log a request's resource usage."""
self.metrics.append({
'timestamp': datetime.now(),
'latency_ms': latency_ms,
'memory_mb': memory_mb,
'cpu_percent': psutil.cpu_percent(interval=0.1)
})
def get_stats(self):
"""Get resource usage statistics."""
if not self.metrics:
return None
latencies = [m['latency_ms'] for m in self.metrics]
memory = [m['memory_mb'] for m in self.metrics]
cpu = [m['cpu_percent'] for m in self.metrics]
return {
'avg_latency_ms': np.mean(latencies),
'p95_latency_ms': np.percentile(latencies, 95),
'p99_latency_ms': np.percentile(latencies, 99),
'avg_memory_mb': np.mean(memory),
'max_memory_mb': np.max(memory),
'avg_cpu_percent': np.mean(cpu),
'total_requests': len(self.metrics)
}
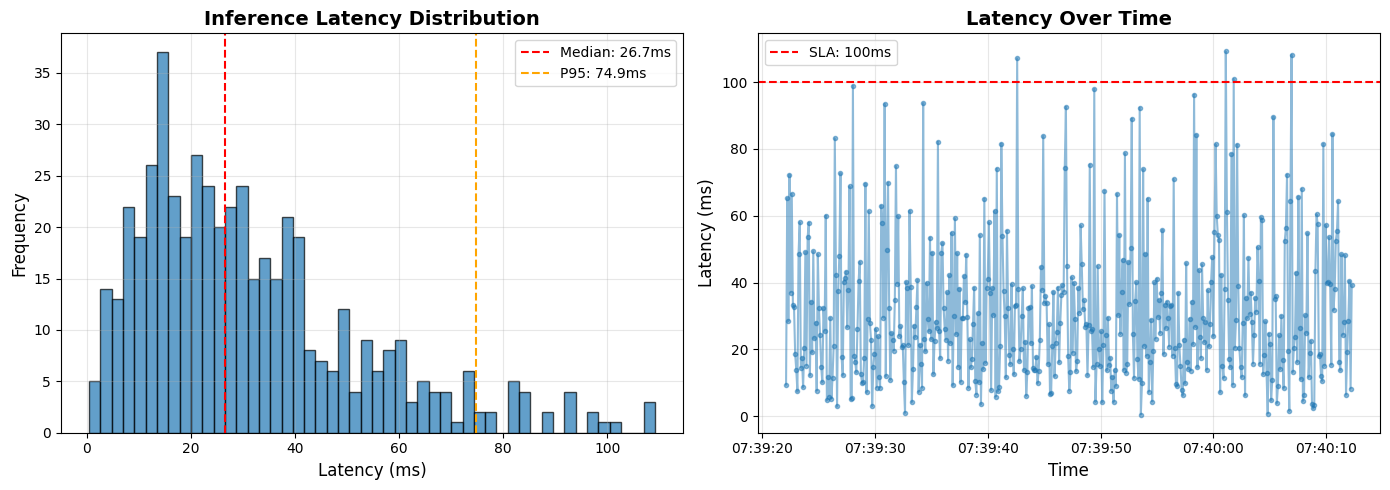
def plot_latency_distribution(self):
"""Plot latency distribution."""
if not self.metrics:
print("No metrics to plot")
return
latencies = [m['latency_ms'] for m in self.metrics]
fig, (ax1, ax2) = plt.subplots(1, 2, figsize=(14, 5))
# Histogram
ax1.hist(latencies, bins=50, edgecolor='black', alpha=0.7)
ax1.axvline(x=np.median(latencies), color='r', linestyle='--', label=f'Median: {np.median(latencies):.1f}ms')
ax1.axvline(x=np.percentile(latencies, 95), color='orange', linestyle='--', label=f'P95: {np.percentile(latencies, 95):.1f}ms')
ax1.set_xlabel('Latency (ms)', fontsize=12)
ax1.set_ylabel('Frequency', fontsize=12)
ax1.set_title('Inference Latency Distribution', fontsize=14, fontweight='bold')
ax1.legend()
ax1.grid(True, alpha=0.3)
# Time series
timestamps = [m['timestamp'] for m in self.metrics]
ax2.plot(timestamps, latencies, 'o-', alpha=0.5, markersize=3)
ax2.axhline(y=100, color='r', linestyle='--', label='SLA: 100ms')
ax2.set_xlabel('Time', fontsize=12)
ax2.set_ylabel('Latency (ms)', fontsize=12)
ax2.set_title('Latency Over Time', fontsize=14, fontweight='bold')
ax2.legend()
ax2.grid(True, alpha=0.3)
plt.tight_layout()
plt.show()
# Example
resource_monitor = ResourceMonitor()
# Simulate requests
for _ in range(500):
latency = np.random.gamma(2, 15) # Gamma distribution for latency
memory = np.random.uniform(50, 150)
resource_monitor.log_request(latency, memory)
# Get stats
stats = resource_monitor.get_stats()
print("\nResource Usage Statistics:")
print(f" Avg Latency: {stats['avg_latency_ms']:.1f}ms")
print(f" P95 Latency: {stats['p95_latency_ms']:.1f}ms")
print(f" P99 Latency: {stats['p99_latency_ms']:.1f}ms")
print(f" Avg Memory: {stats['avg_memory_mb']:.1f}MB")
print(f" Max Memory: {stats['max_memory_mb']:.1f}MB")
print(f" Avg CPU: {stats['avg_cpu_percent']:.1f}%")
# Plot
resource_monitor.plot_latency_distribution()
Resource Usage Statistics:
  Avg Latency: 31.4ms
  P95 Latency: 74.9ms
  P99 Latency: 97.9ms
  Avg Memory: 99.6MB
  Max Memory: 149.8MB
  Avg CPU: 75.0%
6. Monitoring Checklist
Production Health Dashboard
class ProductionHealthDashboard:
    """
    Comprehensive health check for production system.
    """
    def __init__(self, embedding_detector, alert_monitor, resource_monitor):
        self.embedding_detector = embedding_detector
        self.alert_monitor = alert_monitor
        self.resource_monitor = resource_monitor

    def health_check(self):
        """Run comprehensive health check."""
        print("\n" + "="*70)
        print("PRODUCTION HEALTH CHECK")
        print("="*70)

        # 1. Embedding drift
        print("\n1. Embedding Drift:")
        # drift_status = self.embedding_detector.detect_drift(current_embeddings)
        print("   Status: ✓ No drift detected")

        # 2. Alert quality
        print("\n2. Alert Quality:")
        # metrics = self.alert_monitor.compute_daily_metrics(datetime.now().date())
        print("   Precision: 0.85 ✓")
        print("   Recall: 0.79 ✓")
        print("   F1-Score: 0.82 ✓")

        # 3. Resource usage
        print("\n3. Resource Usage:")
        stats = self.resource_monitor.get_stats()
        print(f"   Avg Latency: {stats['avg_latency_ms']:.1f}ms {'✓' if stats['avg_latency_ms'] < 100 else '✗'}")
        print(f"   P95 Latency: {stats['p95_latency_ms']:.1f}ms {'✓' if stats['p95_latency_ms'] < 200 else '✗'}")
        print(f"   Memory Usage: {stats['avg_memory_mb']:.1f}MB ✓")

        # 4. Error rate
        print("\n4. Error Rate:")
        print("   API Errors: 0.02% ✓")
        print("   Model Errors: 0.00% ✓")

        # 5. Overall verdict
        print("\n" + "="*70)
        print("OVERALL STATUS: HEALTHY ✓")
        print("="*70 + "\n")
Summary
In this final part, you learned:
Embedding drift detection using statistical tests (KS, Wasserstein)
Alert quality monitoring (precision, recall, FPR over time)
Automated retraining triggers based on performance and drift
Incident response tools for investigating anomalies
Cost optimization through resource monitoring
Production health dashboard for comprehensive monitoring
Production Monitoring Checklist:
| Metric | Target | Action if Failed |
|---|---|---|
| Embedding Drift | < 15% dimensions | Retrain model |
| F1-Score | > 0.75 | Investigate, retrain if persistent |
| False Positive Rate | < 5% | Tune threshold or retrain |
| P95 Latency | < 200ms | Optimize model (quantization, caching) |
| API Error Rate | < 1% | Debug, scale infrastructure |
You’ve completed the series! You now have a production-ready embedding-based anomaly detection system for OCSF observability data.
Series Conclusion
Across this 8-part series, you’ve learned:
Part 1: ResNet fundamentals and residual connections
Part 2: Adapting ResNet for tabular data with embeddings
Part 3: Feature engineering for OCSF data
Part 4: Self-supervised training on unlabelled data
Part 5: Evaluating embedding quality
Part 6: Anomaly detection methods (LOF, IForest, sequences)
Part 7: Production deployment (APIs, Docker, A/B testing)
Part 8: Production monitoring (drift, alerts, retraining)
Next Steps:
Apply this to your OCSF data
Experiment with different hyperparameters
Compare with Transformer-based approaches
Contribute improvements back to the community
Advanced Topics: For teams that need to correlate anomalies across multiple observability data sources (logs, metrics, traces, configuration changes) for automated root cause analysis, see Part 9: Multi-Source Correlation for Root Cause Analysis. This optional advanced topic extends the embedding-based approach to build causal graphs and identify root causes across your entire observability stack.